Monitoring tells you that the system is failing. Observability tells you why: which request, through which service, stuck behind which dependency. For that, the three signals, traces, metrics and logs, must come from every part of the system and land where people can read them together. OpenTelemetry is the standard that makes this possible, and the question every team meets after the first demo is not how to produce telemetry, but where to send it.
When I teach OpenTelemetry, I wire the same small system twice. Three Java services: the first calls the second over HTTP, the second produces a message to Kafka, the third consumes it. Same code both times. Only the wiring changes, and the second wiring is the one that survives contact with real production systems.
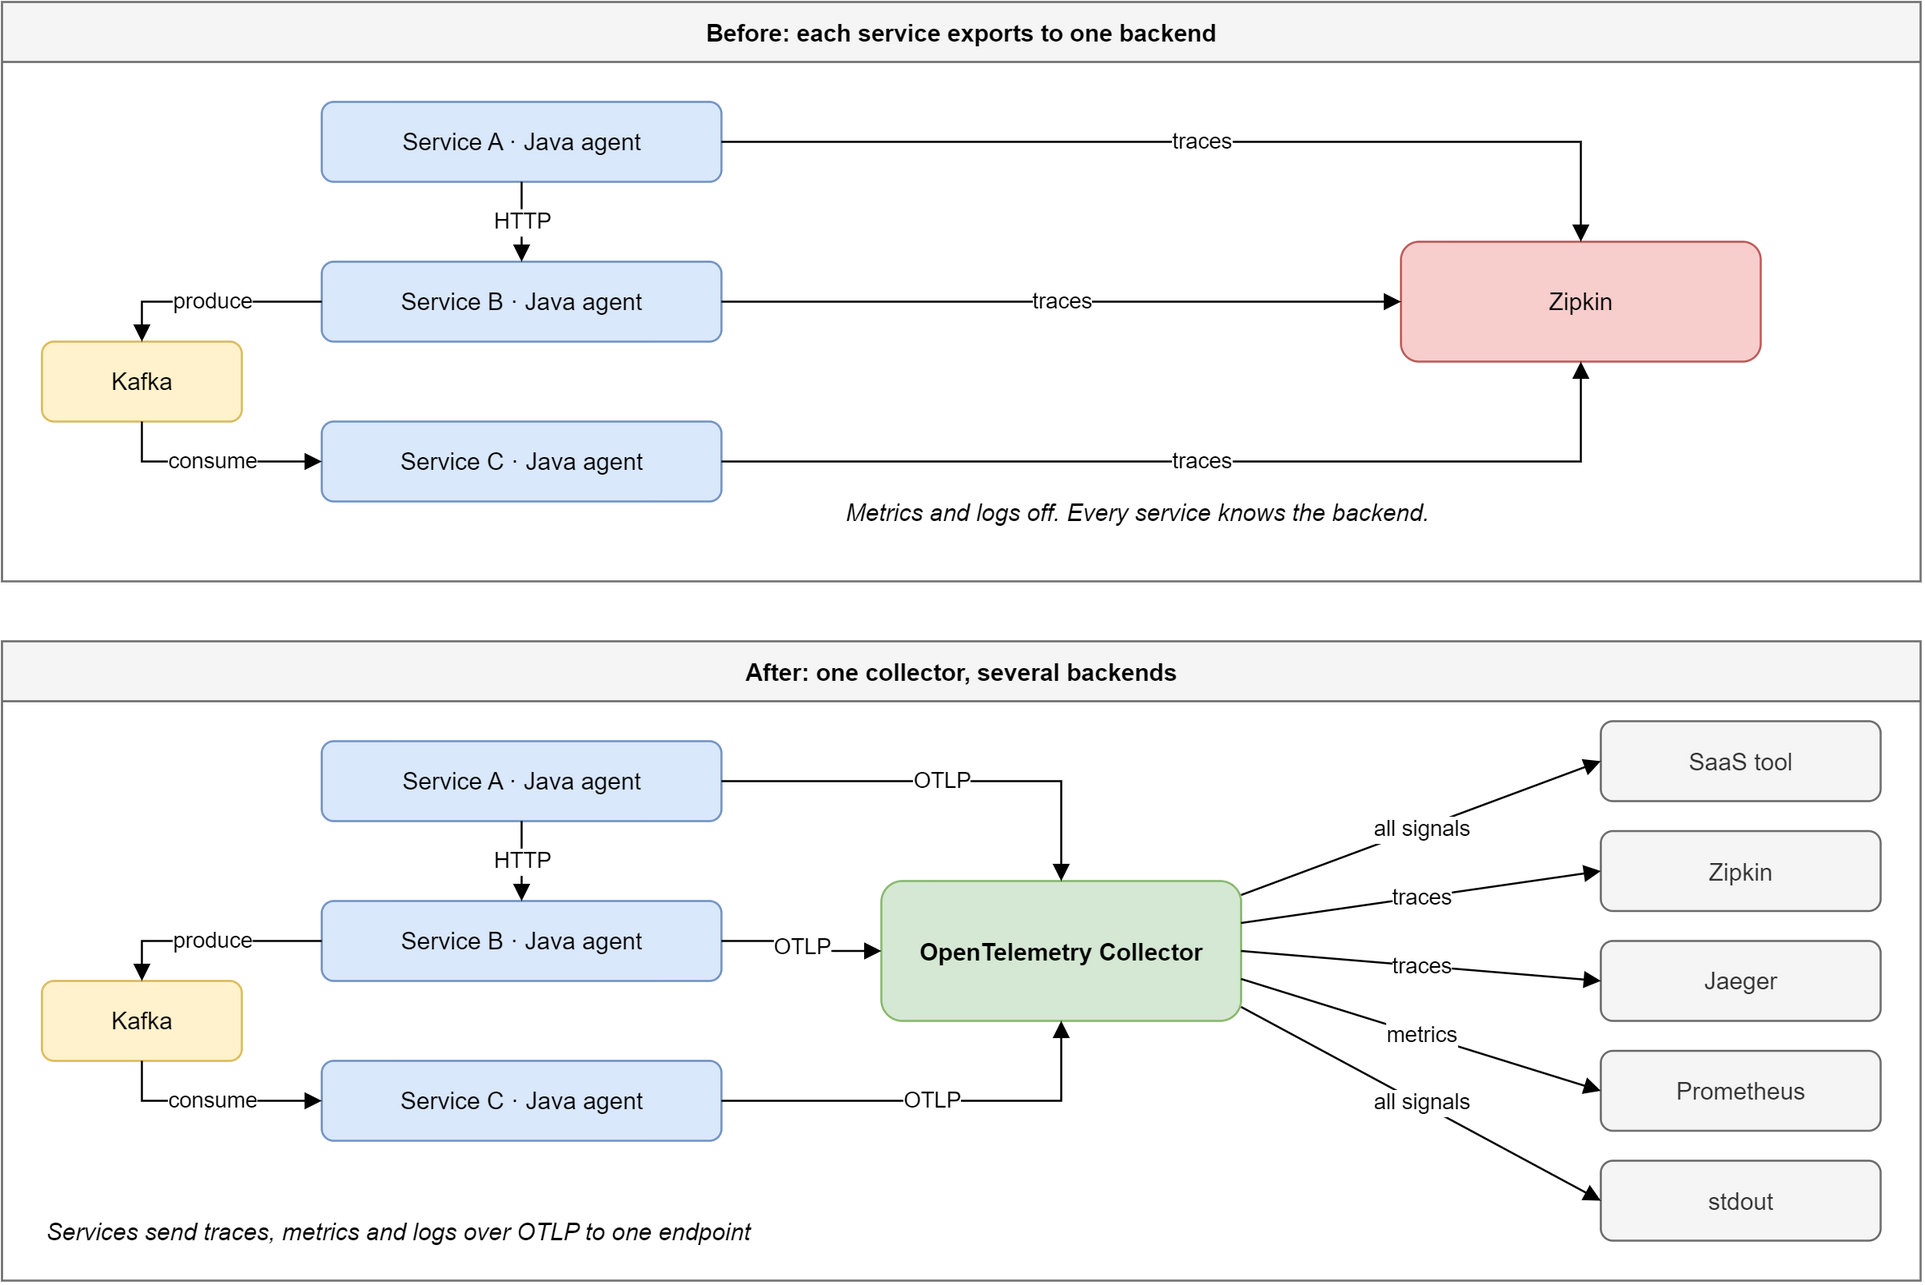
First wiring: every service talks to Zipkin
The OpenTelemetry Java agent instruments an application without touching its code. It attaches to the JVM, recognises the HTTP servers and clients, the Kafka producers and consumers, the JDBC drivers, and emits spans for each call. In the first wiring, each service gets the agent and three settings:
java -javaagent:opentelemetry-javaagent.jar \
     -Dotel.service.name=service-b \
     -Dotel.traces.exporter=zipkin \
     -Dotel.metrics.exporter=none \
     -jar service-b.jar
Traces go straight to a Zipkin server; metrics are switched off, and so are logs, which the agent does not export unless you ask it to. The result is impressive for so little work: one trace follows a request from the first service, through the HTTP call, into Kafka and out of the consumer, with the context propagated across the broker.
Then someone asks for a second backend. The operations team wants the metrics in Prometheus, another team already runs Jaeger, a pilot wants to try a commercial tool. Each request means a new exporter in every service, a new configuration and a restart. Filtering a sensitive attribute means changing every service. Changing tools means redeploying everything. The services have learnt where their telemetry goes, and that knowledge does not belong to them.
Second wiring: a collector in between
In the second wiring, the agents send all three signals over OTLP, the OpenTelemetry protocol, to one endpoint: a collector. The services know nothing else. The collector exports everything to the console and to a commercial tool, the traces to Zipkin and to Jaeger, the metrics to Prometheus. Adding a destination is now a change in one configuration file, in one place, without touching the services.
The protocol matters as much as the collector. OTLP is the native format of OpenTelemetry; once the sources speak it, the receiving end can be anything that understands it. Jaeger itself now accepts OTLP directly, which is why the collector’s dedicated Jaeger exporter is already marked deprecated: the plain OTLP exporter does the job.
Inside the collector: receivers, processors, exporters
A collector does three things with data: it collects it, transforms it, and exports it. Each step is a family of components.
- Receivers accept data, either pushed to them (OTLP, Zipkin, Jaeger) or pulled by them (a Prometheus scrape, a log file, a database).
- Processors act on data in transit: they batch it, limit memory, add, delete or hash attributes, drop what nobody needs.
- Exporters send it on, to a backend or to another collector.
A pipeline binds them for one signal: a traces pipeline, a metrics pipeline,
a logs pipeline. Two pipelines may share a receiver or an exporter, so one OTLP
endpoint feeds all three. Extensions sit beside the pipelines and handle the
collector itself: a health check, pprof profiling, zpages for live
debugging.
The second wiring fits in one file:
receivers:
  otlp:
    protocols:
      grpc:
      http:

processors:
  memory_limiter:
    check_interval: 1s
    limit_mib: 512
  attributes/scrub:
    actions:
      - key: http.request.header.authorization
        action: delete
  batch:

exporters:
  zipkin:
    endpoint: http://zipkin:9411/api/v2/spans
  otlp/jaeger:
    endpoint: jaeger:4317
    tls:
      insecure: true
  prometheus:
    endpoint: 0.0.0.0:8889
  logging:
    verbosity: detailed

extensions:
  health_check:
  zpages:

service:
  extensions: [health_check, zpages]
  pipelines:
    traces:
      receivers: [otlp]
      processors: [memory_limiter, attributes/scrub, batch]
      exporters: [zipkin, otlp/jaeger, logging]
    metrics:
      receivers: [otlp]
      processors: [memory_limiter, batch]
      exporters: [prometheus, logging]
    logs:
      receivers: [otlp]
      processors: [memory_limiter, batch]
      exporters: [logging]
Order matters inside a pipeline: the memory limiter comes first, so that the
collector refuses data before it runs out of memory, and the batch processor
comes after it. On the agent side, the traces and metrics exporters go back to
their default, otlp, logs are switched on with otel.logs.exporter=otlp, and
otel.exporter.otlp.endpoint points to the collector.
Be warned: this file grows fast. Every receiver, processor and exporter has its own settings, and a real collector configuration soon runs to hundreds of lines that are hard on the eyes. Keep it in Git and review it like code.
Any backend: a reference deployment
The demo proves the principle. The deployment I now use as a reference shows what it buys on a real stack, where most sources are not instrumented applications.
On the source side:
- A Java application on Tomcat runs the Java agent, which sends traces, metrics, logs and JVM metrics over OTLP.
- An ActiveMQ broker runs the same agent, whose JMX metrics module ships a ready-made ActiveMQ target, and sends the broker and JVM metrics over OTLP.
- PostgreSQL is read twice: by the collector’s
postgresqlreceiver, and by Coroot’s pg-agent, a Prometheus exporter that theprometheusreceiver scrapes. - Log files are tailed by the
filelogreceiver, system logs arrive through thesyslogreceiver, and thehostmetricsreceiver reads CPU, memory and disks. - Fluent Bit, a lightweight agent written in C, runs on the hosts and sends logs and metrics to the collector over OTLP.
On the destination side, two complete stacks, chosen per environment. Either the OpenSearch stack: the collector exports OTLP to Data Prepper, which writes into OpenSearch, read through OpenSearch Dashboards. Or the Grafana stack: logs to Loki through the collector’s Loki exporter, traces to Tempo over OTLP, metrics to Mimir over OTLP, all three read in Grafana. Zipkin, Jaeger or a commercial APM remain possible on the side.
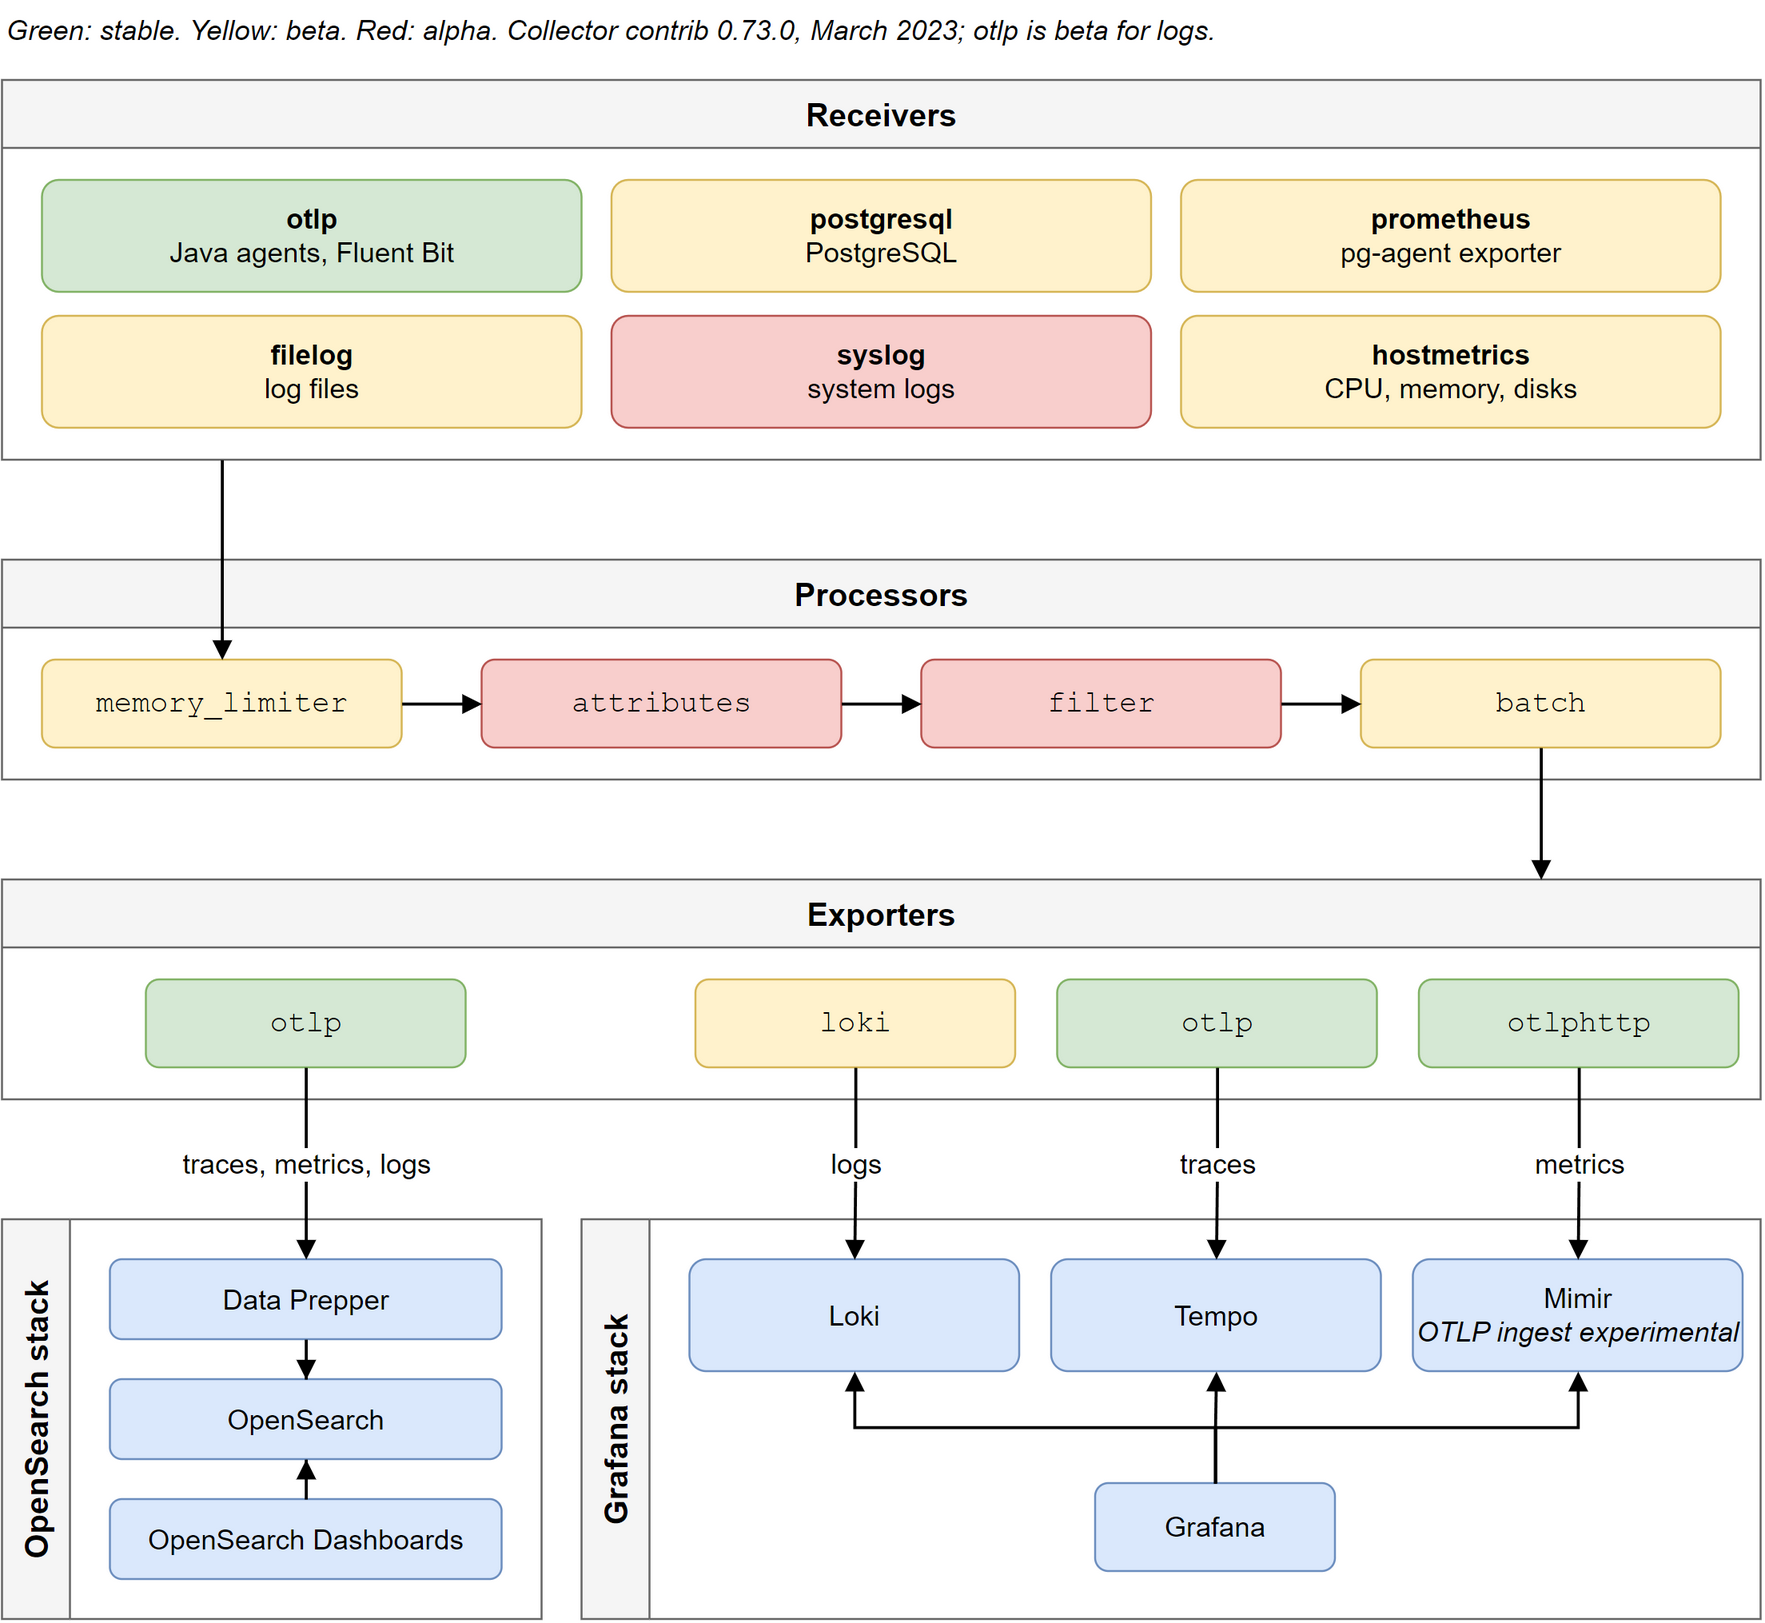
Nothing on the source side knows which stack is behind the collector. That is the point. Environments need not run the same tool: a development environment can use the open-source stack while another uses a paid product, and paid observability tools are expensive enough to make that choice worth having. Standardise the collection, not the tool.
Read the stability label before you depend on it
Every collector component publishes a stability level for each signal it handles. Alpha means ready for limited, non-critical workloads, with configuration that may change often. Beta means the configuration is deemed stable, with breaking changes kept to a minimum. Stable means ready for general availability. The label belongs in the architecture, next to the arrow it describes.
As of the collector contrib release of March 2023, version 0.73.0, the reference
deployment reads like this. The OTLP receiver and exporter are stable for traces
and metrics, beta for logs. The postgresql, prometheus, filelog and
hostmetrics receivers are beta, the Loki exporter is beta, and the syslog
receiver is alpha. The attributes and filter processors, the very ones that
remove sensitive data, are alpha; batch and memory_limiter are beta. The
collector itself is still versioned 0.x.
Logs are the uneven signal, and not only in the collector. In the specification,
traces and metrics have stable APIs and largely stable SDKs, and the log data
model and its OTLP encoding are stable, but the logs bridge API and SDK are
still experimental. The Java agent ships with its logs exporter set to none by
default. Quarkus’s OpenTelemetry extension covers traces only. Data Prepper has
accepted OpenTelemetry logs since its 2.1 release, less than two weeks old. On
the destination side, a stable exporter says nothing about the receiving end:
Mimir’s OTLP ingestion path is still flagged experimental, and Loki has no OTLP
endpoint at all, hence the dedicated exporter.
None of this argues for waiting. It argues for reading the labels and placing
each component accordingly. An alpha syslog receiver on a path nobody pages on
is a fair bet. The logs of a service you must debug at night deserve a fallback:
for Quarkus services, my recommendation is to send traces through OpenTelemetry
and, for now, logs and metrics through Fluent Bit. The diagram carries the
labels, so the next person who reads it knows which arrows may move.
Where the collector runs
A single collector in the demo becomes several in production, and a handful of rules decide where.
- Close to the applications, one per environment. The collector is the first hop, so it sits next to what it collects.
- Sized per business domain and per environment. A busy domain gets its own collectors rather than starving the others.
- Scalable collectors behind a gateway in production. Local collectors forward to a tier of gateway collectors, several instances behind a load balancer, which send the data on to the backends.
- Filter before it leaves. Delete or hash sensitive attributes, drop the data nobody reads, reduce the flows. A collector that only forwards is a missed opportunity.
The same data then serves different readers. One collector feeds a business view of activity, a developer view of application load, an operations view of CPU, memory and disks, a database view of PostgreSQL. Business metrics deserve a word of caution: they show a trend in the state of the system, a forecast, not a consolidated report. Choose and build them with the feature, iteratively, rather than at the end.
The services should not know
The first wiring is the right way to start and the wrong way to stay. Every backend a service knows about is a deployment you will have to repeat. Put a collector between the two sides, speak OTLP on the way in, write the stability label on every arrow, and the choice of backend becomes what it should have been from the start: a line in one configuration file.